
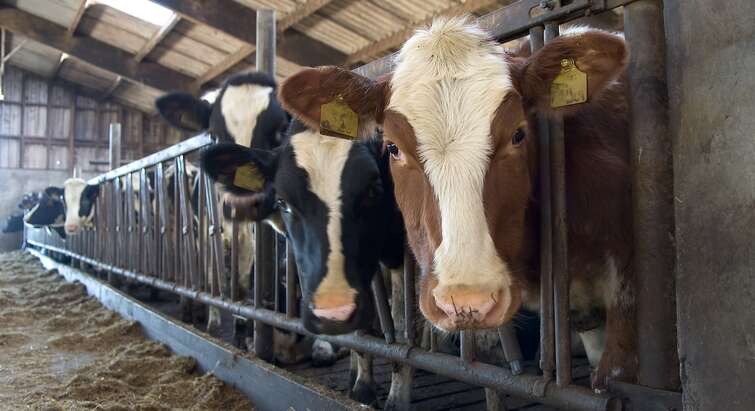
Dairy cattle welfare
2023.10.24
The work to promote market-driven animal welfare in Denmark gained momentum in 2017 with the introduction of the voluntary state animal welfare label, Better Animal Welfare, with three steps (marked with 1, 2 or 3 hearts). In 2017, the label was launched for pork, in 2018 chicken meat followed, and in 2020 the label was expanded to include dairy products and beef. The benchmark project has so far followed this development from the beginning until 2024.
The total production of milk in Denmark has been very stable during the period. Table 3 shows the total production of milk as well as the proportion of milk that is produced with higher standards than those required by animal welfare legislation in Denmark. The share of milk from production with extra welfare is fairly stable, with a slight increase in 2023, which covers increases in the production of Heart 1 and Heart 2 milk and a decrease in the share of organic milk production (with 3 hearts). In 2024, there was a decrease in the share of welfare milk of just over 7 percentage points from 25.5% in 2023 to 17.9% in 2024. This is due to a decrease in both Heart 1 and Heart 2 milk (in fact, virtually no Heart 2 milk was produced in 2024), as well as an 8% decrease in the amount of organic milk.
The Heart 1 level ensures, among other things, improved indoor conditions, while Heart 2 ensures, among other things, that all dairy cows get out to pasture. Heart 3 requires that both cows and heifers go to pasture, just as is required in organic production.
Table 3. Overview of milk produced in Denmark 2020-2024 and share of milk produced in production systems offering welfare that exceeds requirements of Danish legislation.
| Total production (1000 tonnes) |
Production of welfare milk (1000 tonnes) |
Share of welfare milk of total production |
Share of organic milk of total production |
|
|---|---|---|---|---|
| 2020 | 5,666 | 1303 | 23.0% | 12.8% |
| 2021 | 5,644 | 1309 | 23.2% | 13.2% |
| 2022 | 5,660 | 1292 | 22.8% | 12.9% |
| 2023 | 5,686 | 1450 | 25.5% | 12.2% |
| 2024 | 5,690 | 1021 | 17.9% | 11.2% |
Note: The term welfare milk is used here for all types of milk from production systems offering welfare that exceeds requirements of Danish legislation. Percentages are based on volumes.
The above-mentioned development in the production of welfare milk is also reflected when the welfare of Danish dairy cattle is measured using the Benchmark method, see Figure 11. Note that the scale in the figure is very detailed to clarify even small estimated differences in the Benchmark values.
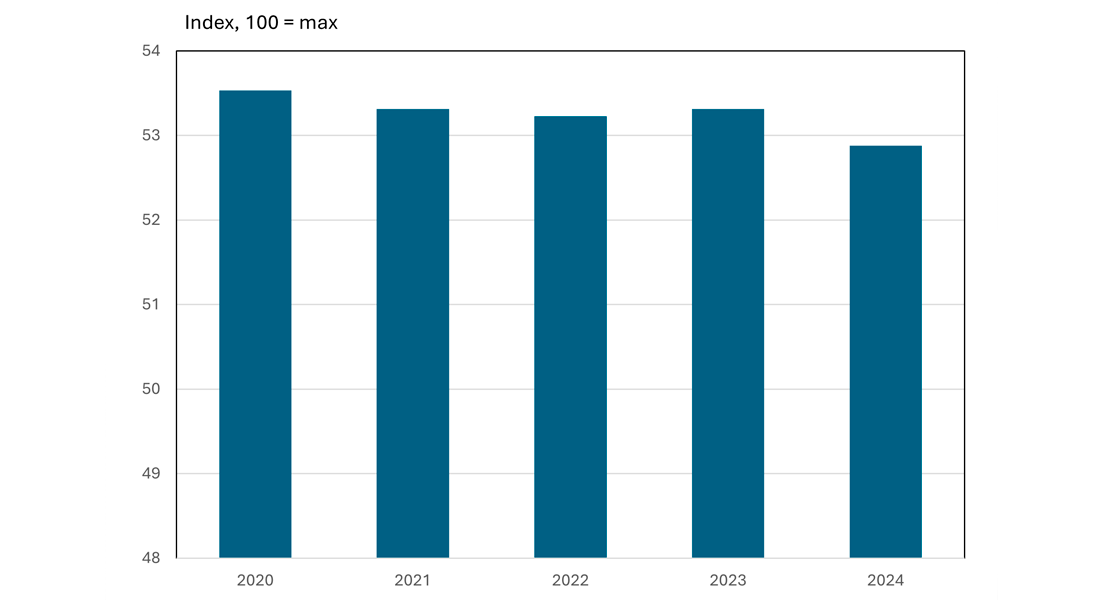
The benchmark method is described in more detail above, and specific information on the methods used on dairy cattle follows below.
That the kind of milk production makes a difference to animal welfare is shown in Figure 12.
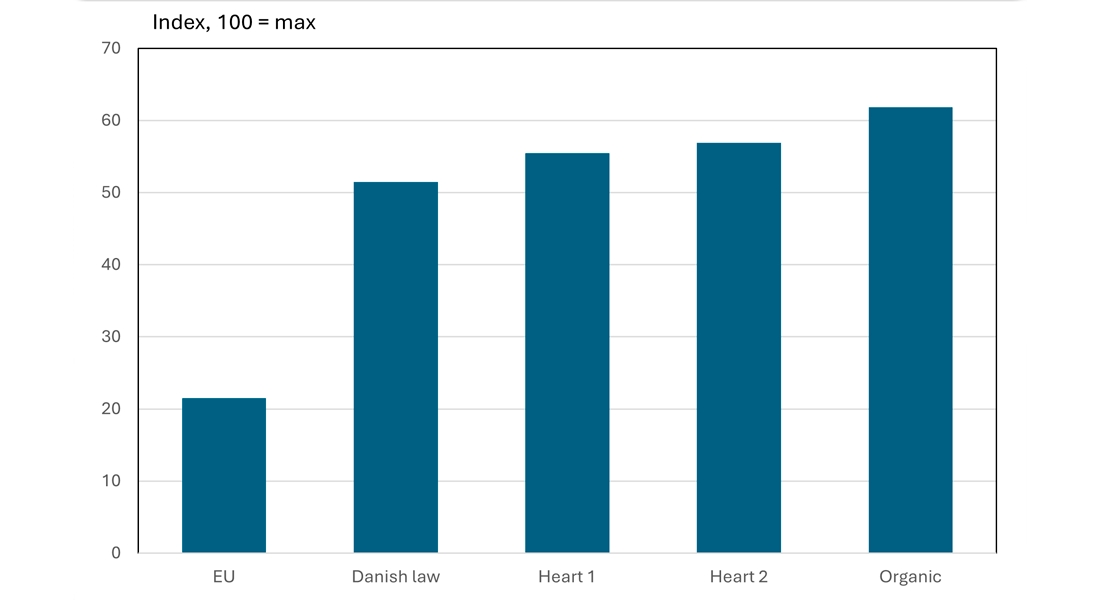
The EU baseline value of 21.5 is based on legislation for calves supplemented with assessed standards of best practice, where the focus is on producing efficiently. The theoretical maximum score is 100, but the actually highest achievable benchmark value is 74.9.
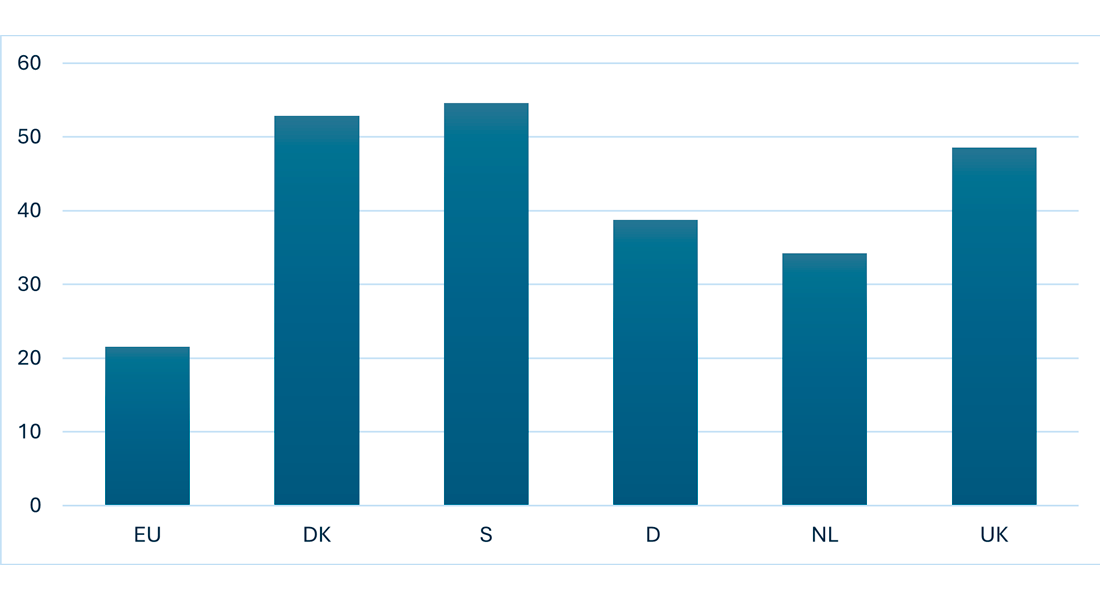
The figure's most important messages are:
There is a big estimated difference between countries in terms of the welfare requirements for dairy cattle. Denmark and Sweden are at the high end. The United Kingdom (UK) ranks almost as high, while the Netherlands and Germany are at the bottom, close to baseline.
There are no common EU requirements for the welfare of dairy cattle – except for calves. The assessment of EU level is therefore based, in addition to the EU's requirements for keeping calves, on an estimate of the conditions under which dairy cattle would be kept, if the focus were solely on ensuring the most efficient milk production.
Milk is used as a raw material in many different foods, not least sour-milk products, butter products and cheese. So far, most attention regarding animal welfare has been paid to the sale of milk for drinking. But only 10-15% of milk production in the countries assessed is used for the production of milk for drinking. Therefore, for dairy cattle, we have not tried to estimate consumption, but only to look at national production.
The fact that milk production in Denmark and Sweden is estimated to be higher on the Benchmark scale is primarily due to two factors:
Firstly, the two countries have more far-reaching legislation relating to cattle welfare than the other three countries. In Sweden, for example, legislation passed in 1988 required all cows and heifers to graze in the summer. In Denmark, there is no requirement for cows to be outdoors, but a 2010 law set relatively detailed requirements for the design of Danish cattle stalls and for care of the animals, e.g. with requirements for calving and sick pens and a certain number of rotating cow brushes. The requirements in the Danish legislation are being phased in with various transitional arrangements. Some have already been implemented, some were implemented in 2024, while the last will apply to all Danish dairy herds with effect from 2034.
The second explanation is that in both countries, a relatively high proportion of milk production in 2024 was either organic or under another animal welfare label. In Sweden, just over 10% of milk production was organic, while in Denmark just over 11% of milk production was organic. In Denmark, almost 7% was produced under other animal welfare labels.
In the UK, there is an industry standard, Red Tractor, which covers 95% of production and which significantly lifts the benchmark value compared to the national baseline. In 2024, 2.6% of milk production in the UK was organic, and about another 10% was produced under other animal welfare labels.
The fact that the Netherlands and Germany are at the bottom is due to two factors: first, there is no national legislation that sets requirements that go much further than the baseline. Secondly, there has so far been relatively little production of organic milk: just 3% of the milk produced in the Netherlands and 4% in Germany is organic. However, it is important to mention that a further 59% of milk in the Netherlands and 31% of milk in Germany is produced under other animal welfare labels, which include requirements for cows and heifers to graze in the summer. Tn contrast In Denmark, in addition to the 11.2% of the milk that was organic, only another 7% was produced with a requirement for summer grazing in 2024. In Germany, a four-step welfare label ('Haltungform') was introduced for dairy products in 2022. In 2024, this was expanded to a five-step labelling scheme (where the highest level was divided into outdoor and organic).
The relative importance of legislation and market-driven initiatives for animal welfare in 2024 is shown in Figure 14.
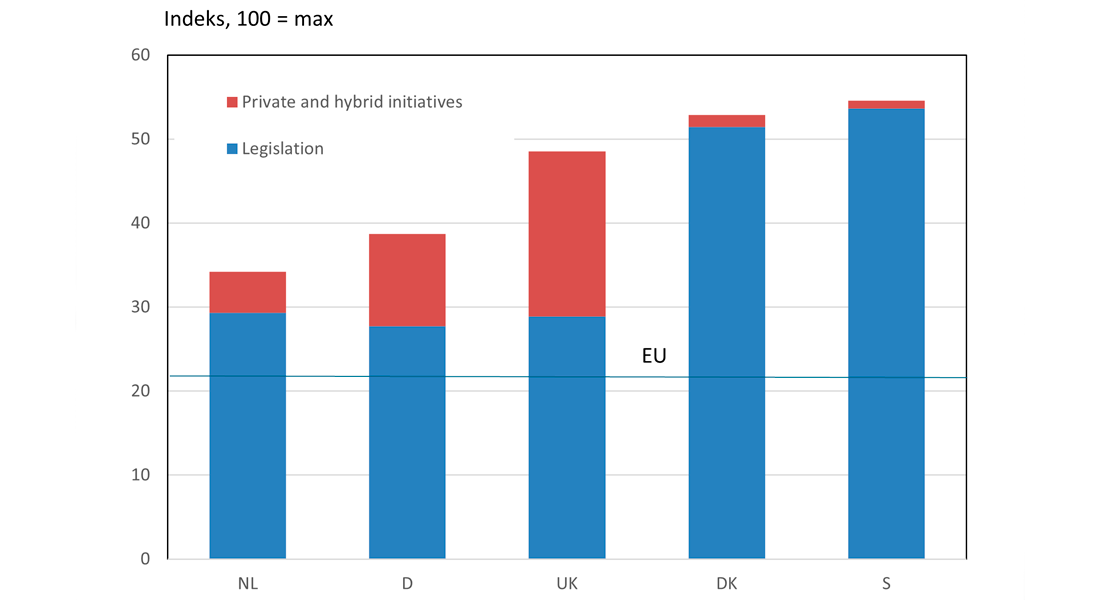
As can be seen, animal welfare in Denmark and Sweden is primarily driven by legislation, while the market-driven initiatives have a greater effect in countries with less extensive legislation.
We define welfare milk as coming from herds that have committed to producing beyond requirements from national legislation which is country-specific. So, what we call welfare milk in Denmark is not the same as in the other countries.
As with all other methods for making major comparisons of animal welfare, there are a number of limitations associated with the Benchmark method in general. The main general limitations are described under the Benchmark method.
In particular, it should be emphasized that the Benchmark method only looks at requirements for national production, which are based either on legislation or various types of labelling or certification schemes. However, it is quite conceivable that some farmers give the animals better conditions than are required of them, which may be the case not least in the Netherlands and Germany. Therefore, the welfare of dairy cattle may actually be higher than what appears in the Benchmark values.
Conversely, we cannot know whether all farmers are actually doing what is required of them under legislation and market-driven schemes. This may mean that the actual animal welfare of dairy cattle may be lower than what is stated in the Benchmark target.
Dairy cattle production is more complicated in several respects than broiler production in particular. There are several stages of production and several products, in addition to milk and the milk products derived from it, including veal and beef. An important limitation of the present study is that it only looks at the production and consumption of milk, while it does not look at the production and consumption of veal and beef.