
Pig production
2023.03.23
The work to promote market-driven animal welfare gained momentum in Denmark in 2017 with the introduction of the voluntary state animal welfare label for pork. The benchmark project has so far followed this development from 2018 to 2024.
At the beginning of the period, the retail chain COOP had its own labelling scheme with four levels, but this scheme was closed down at the end of 2022, and the products were placed under the state brand.
Even before 2017, a number of labels aimed to ensure animal welfare in pigs at a level that was higher than standard production, e.g. the organic label and various private labels such as Frilandsgrisen, Antonius and Bornholmergrisen. Several of these brands were and still are supported by Animal Protection Denmark.
With the introduction of the state labelling scheme for animal welfare, the development and dissemination of animal products produced with focus on animal welfare got a boost. This can be seen from Table 1, where the development is followed from 2018 to 2024.
Table 1. Overview of number of pigs produced and slaughtered in Denmark 2018-2024 together with the shares of welfare pigs in national production and consumption.
|
Pigs produced in DK (million) |
Pigs slaughtered in DK (million) |
Weaners exported (million) |
Welfare pigs produced in DK (million) |
Share of welfare pigs (% of pigs slaughtered in DK) |
Share of welfare pigs (% of pigs produced in DK) |
Share of welfare pork (% of Danish consumption of pork) |
|
|
2018 |
32 |
18 |
14 |
0,22 |
1,2% |
0,7% |
11% |
|
2021 |
33 |
19 |
14 |
0,50 |
2,7% |
1,5% |
15% |
|
2022 |
32 |
18 |
14 |
0,45 |
2,5% |
1,4% |
12% |
|
2023 |
30 |
15 |
15 |
0,42 |
2,9% |
1,4% |
11% |
|
2024 |
30 |
14 |
16 |
0,38 |
2,7% |
1,3% |
10% |
Note: The term welfare pigs/pork is used here for all types of pigs from production systems offering welfare in excess of Danish legislation. Percentages are based on volumes.
As can be seen from the table, in the period from 2018 to 2021, Denmark more than doubled the production of welfare pigs, both measured in absolute numbers, in the proportion of slaughtered pigs and in the proportion of pigs produced. Note that the term welfare pig is used here for all types of pigs that have a welfare higher than Danish legislation. (Pigs produced for the British market (so-called UK pigs) are not considered welfare pigs in this context due to minimal differences between these pigs and standard pigs.)
The number of pigs produced is much larger than the number of pigs slaughtered, as a large and increasing proportion of the pigs produced are exported as live piglets (typically weighing around 30 kg), which are then fattened and slaughtered in other countries. In 2023, there were as many exported piglets as there were pigs fattened and slaughtered in Denmark. In 2024, approximately 14 million pigs were fattened and slaughtered in Denmark, while approximately 16 million were exported as piglets.
Although there was a sharp increase in the production of welfare pigs at the beginning of the period, the share of welfare pigs then and now constitutes a very small part of total production. This is partly because the majority of the pigs produced are standard pigs for export, while the majority of the welfare meat is consumed in the Danish market. Therefore, the share of welfare meat consumed in the Danish market is up to ten times higher than the share of the total Danish pig production (of which approx. 90% is exported).
Looking at the consumption of welfare pork in Denmark, there was an increase from 11% to 15% in the period from 2018 to 2021. From 2021 onwards, however, there has been a decline, so that the relative share of welfare pork in 2024 was down to a lower level (10%) than in 2018 (11%). This development is probably linked to inflation and high food prices in the wake of the Covid crisis and the war in Ukraine. Although the Danes' finances have improved in the latter part of the period, a crisis awareness seems to have taken hold in terms of meat purchasing.
This development is also reflected when measuring the welfare of the Danish pigs with the Benchmark method (Figure 1).
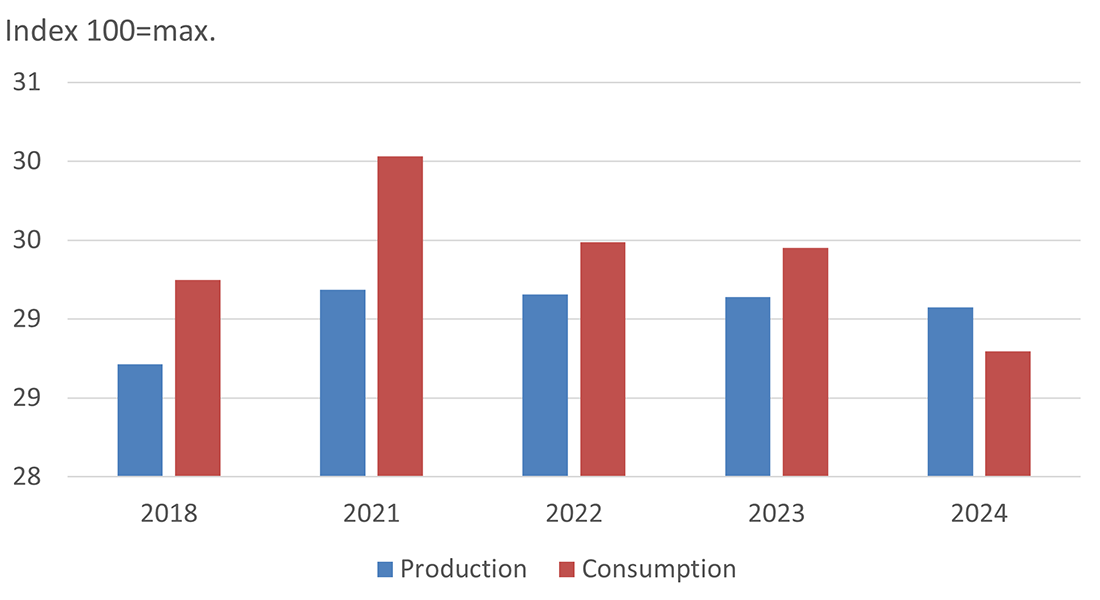
As shown in the figure, an apparent increase in the Benchmark value for pig welfare is seen from 2018 to 2021 for both total national production and national consumption; while from 2021 there is apparent stagnation in production and apparent decline in consumption. Data suggests that the value of national consumption has decreased more than the value of national production because while Danes bought less welfare-labelled pork during the period, they succeeded in establishing a relatively large export of especially organic pork. Note that the scale in the figure is very detailed, which highlights the relatively small differences in the estimated Benchmark values.
The theoretical maximum score is a Benchmark value of 100, but the actually highest achievable Benchmark value is 75.1.
If we look at the four other countries followed in the Benchmark project, the Netherlands, Great Britain, Sweden and Germany, we see a similar development over time, with either a decline or stagnation in market-driven animal welfare.
The way in which pork is produced is of great importance for animal welfare (Figure 2).
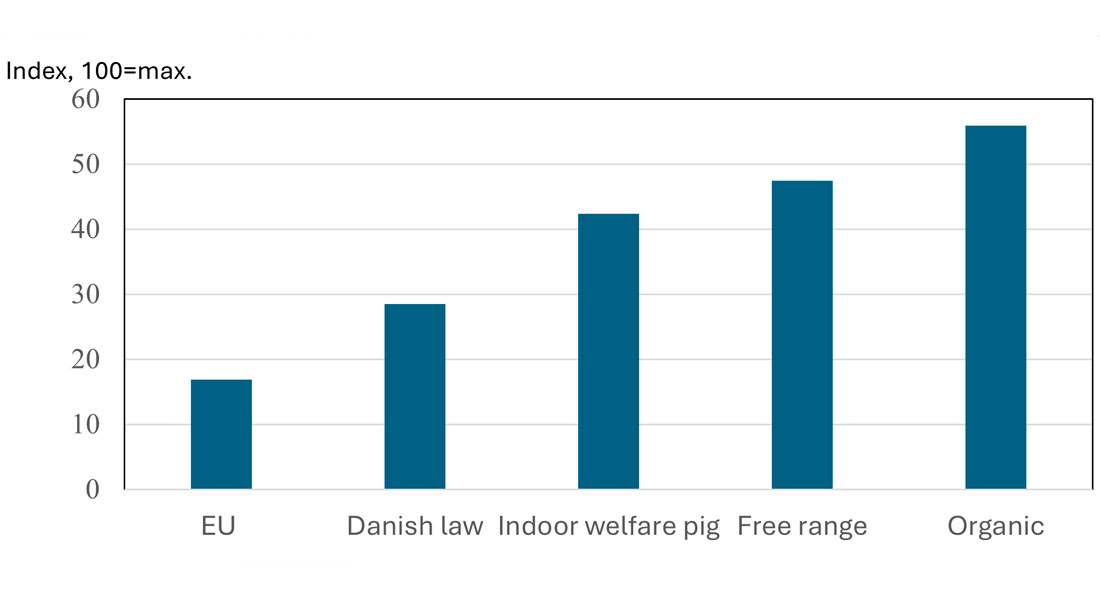
The welfare measured by the Benchmark method increases steadily across the brands, with greater welfare being awarded more hearts. Organic pig production Is the production method that gives the highest Benchmark value.
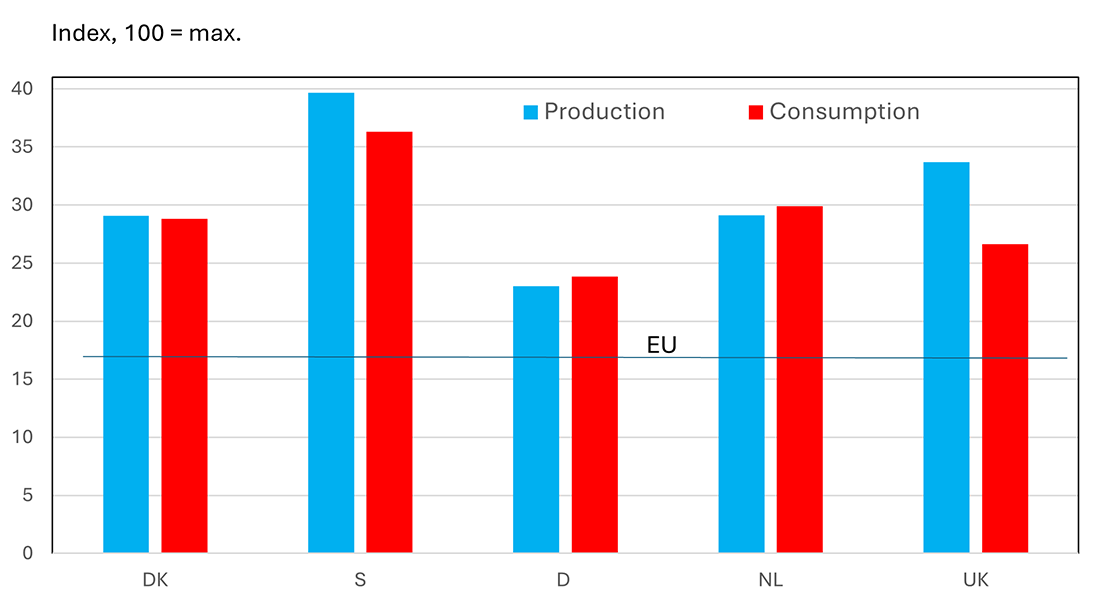
Figure 3's key messages
There is a big difference between countries in relation to how good welfare is for the pigs being produced. Denmark, the Netherlands and the United Kingdom are in the middle of the field, while Germany is below and Sweden at the top in terms of animal welfare in national production.
Consumers' choice of products evens out differences related to national production, e.g. based on high national regulatory requirements. This is most evident in Sweden and the UK, where high regulatory requirements (in Sweden's case) or high standards in practice (in the case of the UK) are partly offset by imports of pork from countries with lower levels of animal welfare.
Here you can read more about the Benchmark method.
Denmark is in the middle group when it comes to level of pork welfare together with the Netherlands and the UK, while Germany is at the bottom and Sweden is at the top.
The explanation for the high ranking of Sweden is that Sweden has very far-reaching legislation, that, for example, requires that sows are kept loose except during a few days after farrowing, requires more space and straw for the slaughter pigs and maintains a ban on tail docking. On the other hand, the contrast is slightly smaller when you look at consumption, as Sweden imports pork produced in countries with lower animal welfare requirements.
The explanation for the UK’s position in the middle group in terms of production is not far-reaching legislation, but instead because a large proportion of the national pig production is based in outdoor sow farms. On the other hand, the Benchmark value for pork consumption is lower, as almost half of the pork consumption in the UK in 2024 was based on lower-welfare imported pork.
The Netherlands, like Denmark, has a large and export-oriented pig production, but there are different explanations for why it ends up at roughly the same level as Denmark. In Denmark, this is mainly due to welfare legislation, while the Netherlands has for some years built up cooperation between animal welfare organisations, the pig industry and the retail trade, creating a domestic market where all fresh pork sold in supermarkets has an animal welfare label.
Denmark is placed above Germany, but it may be only a matter of time before Germany moves up, as Germany has plans to phase in stricter legislative requirements for animal welfare. Whether the objectives are achieved will depend on the political situation in Germany.
Figure 4 shows how much of the animal welfare in production in each country is due to market-driven and regulatory initiatives, respectively.
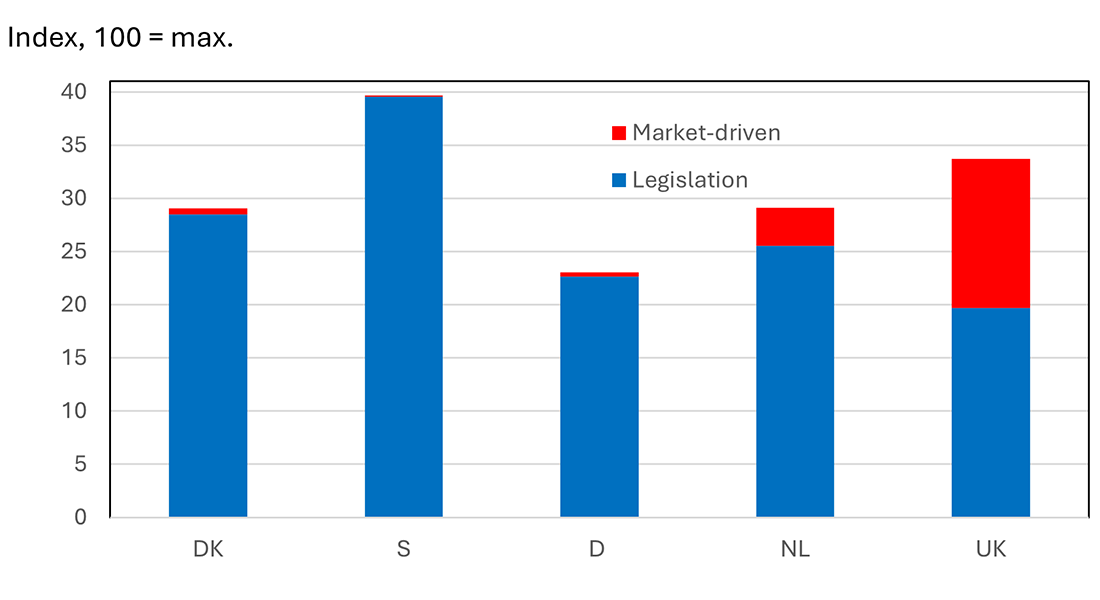
As can be seen, legislation plays by far the most important role in the level of welfare achieved for pigs in Sweden, Denmark and Germany, while Danish legislation undermins an intermediate welfare level compared to the high level in Sweden and the relatively low level in Germany.
As with all other methods for making major comparisons of welfare, there are a number of limitations associated with the Benchmark method. The main general limitations are described under the Benchmark method.
We define welfare pigs as those pigs with welfare higher than required by national legislation – it is country-specific. So what we call a welfare pig in Denmark is not necessarily the same as in the other countries.